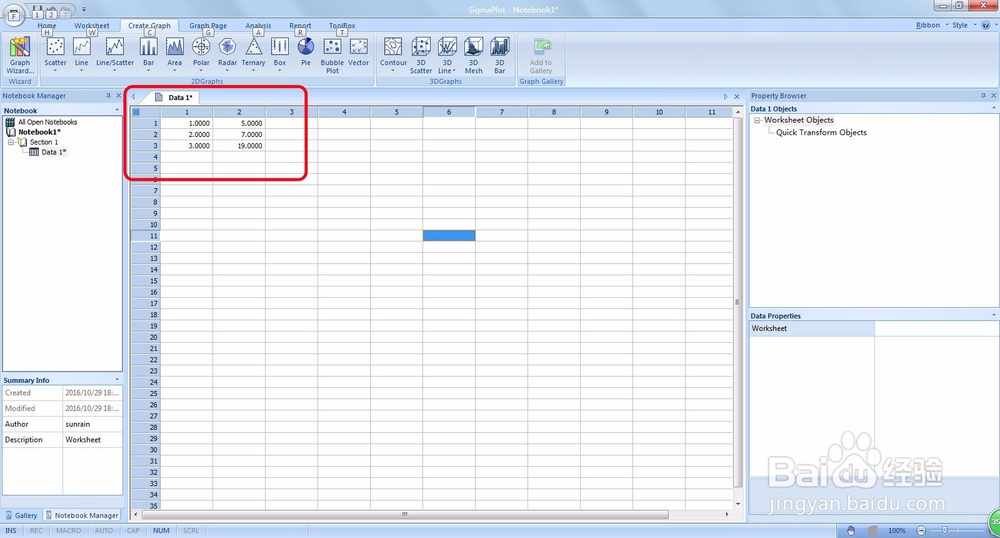
1、打开SigmaPlot 12.0软件,输入所需要绘制的数据
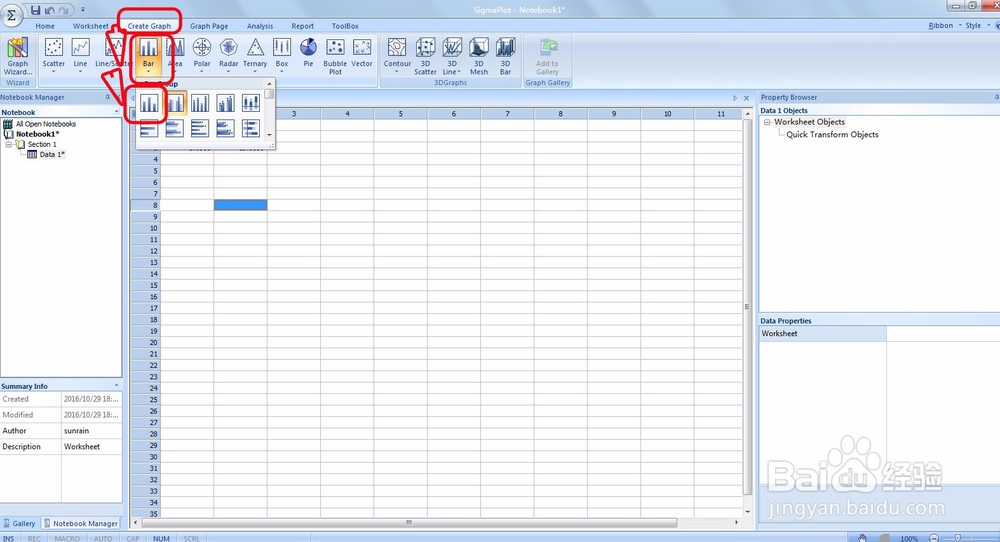
2、选择顶部菜单栏上的“create graph”-----------“bar”------第一个命令
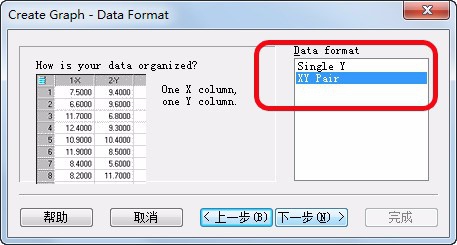
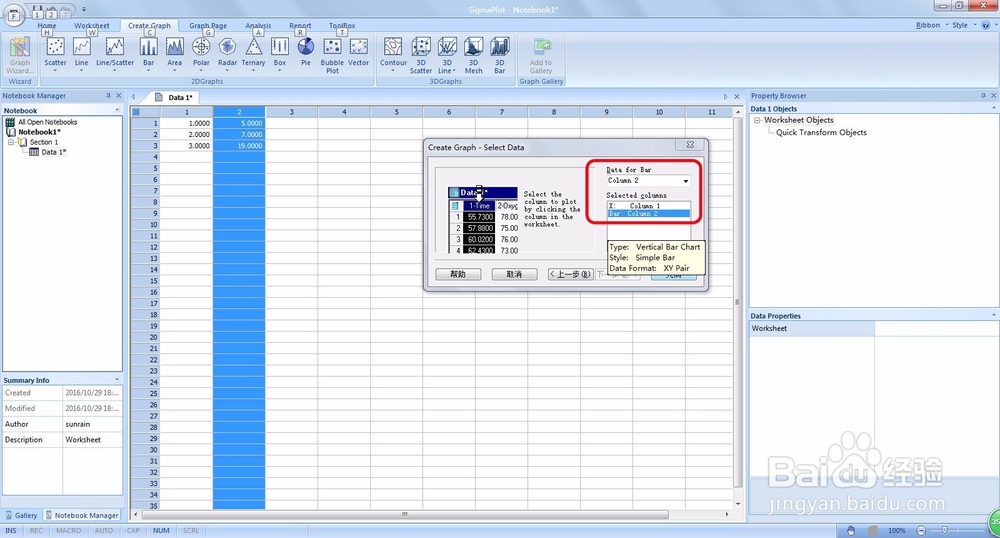
3、调出绘制图形菜单,选择好X和bar轴。
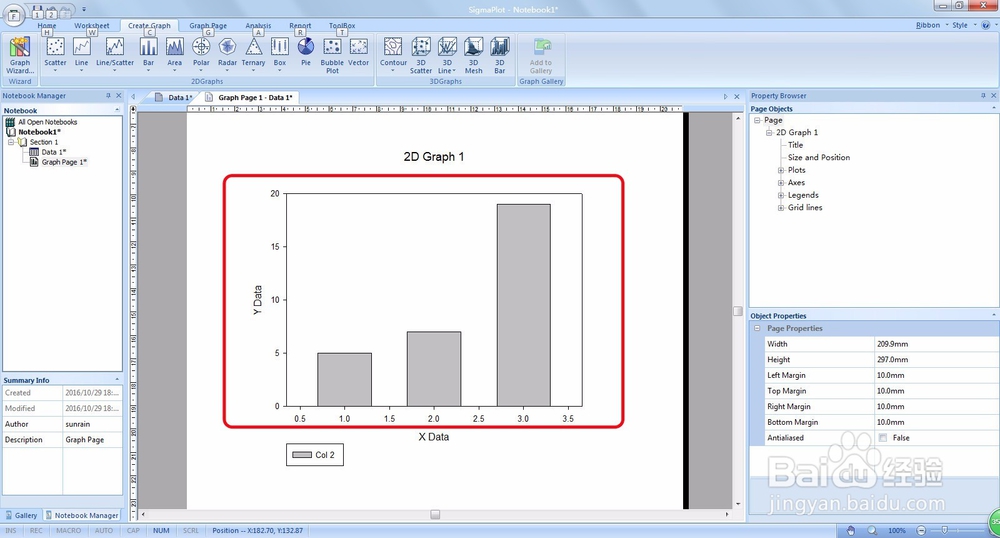
4、绘制出了所需要的柱状图
时间:2026-05-09 21:21:29
1、打开SigmaPlot 12.0软件,输入所需要绘制的数据
2、选择顶部菜单栏上的“create graph”-----------“bar”------第一个命令
3、调出绘制图形菜单,选择好X和bar轴。
4、绘制出了所需要的柱状图
