1、金字塔形:
f[x_, y_] := -Abs[x + y] - Abs[x - y]
等高线图如下:
ContourPlot[f[x, y], {x, -10, 10}, {y, -10, 10}, Frame -> False,
ColorFunction -> Hue, Contours -> 20, ImageSize -> 500]

2、把金字塔形拓展为双周期:
f[g[x, 2], g[y, 2]]
3、f[g[x, 5], g[y, 3]],两个周期分别是5和3:

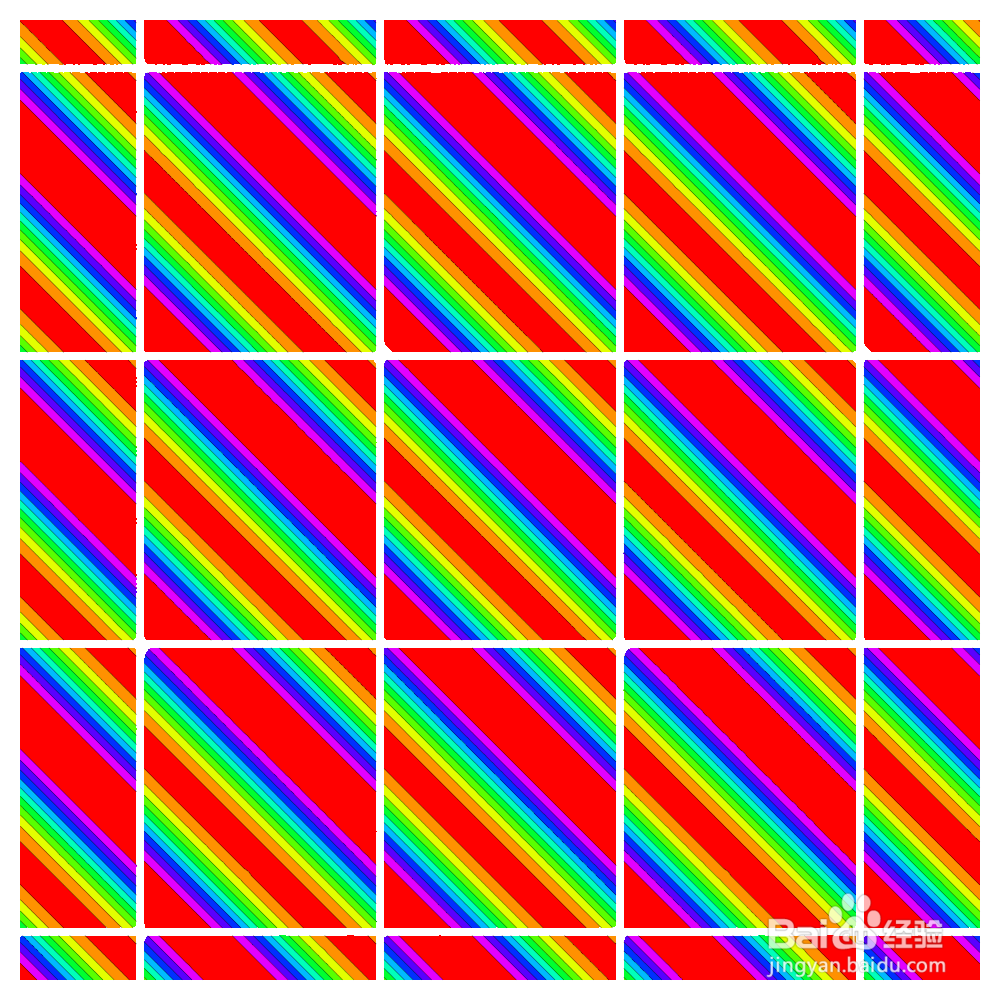
4、斜向排列:
f[g[x, 5], g[x + y, 3]]

5、重定义函数:
f[x_, y_] := Abs[x] + Abs[y]
拓展为双周期:
f[g[x, 5], g[y, 5]]
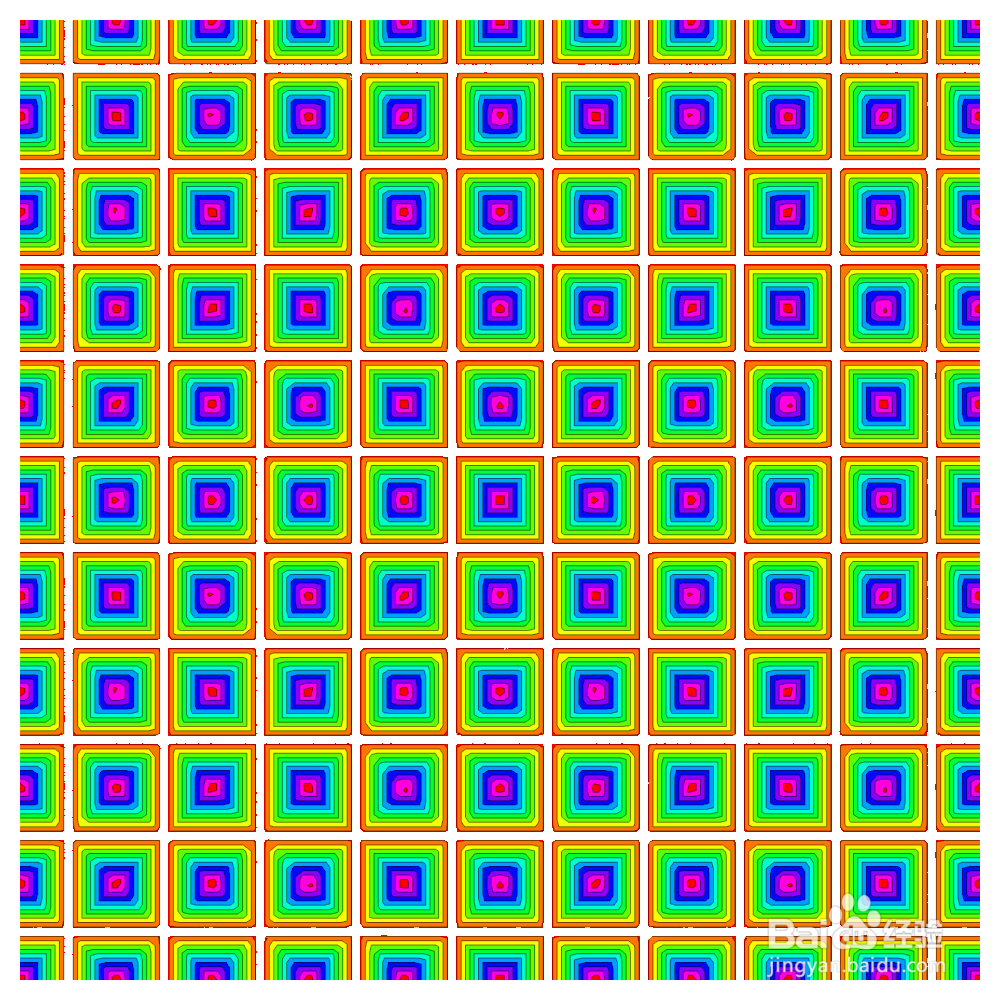
6、周期不相同:
f[g[x, 4], g[y, 6]]

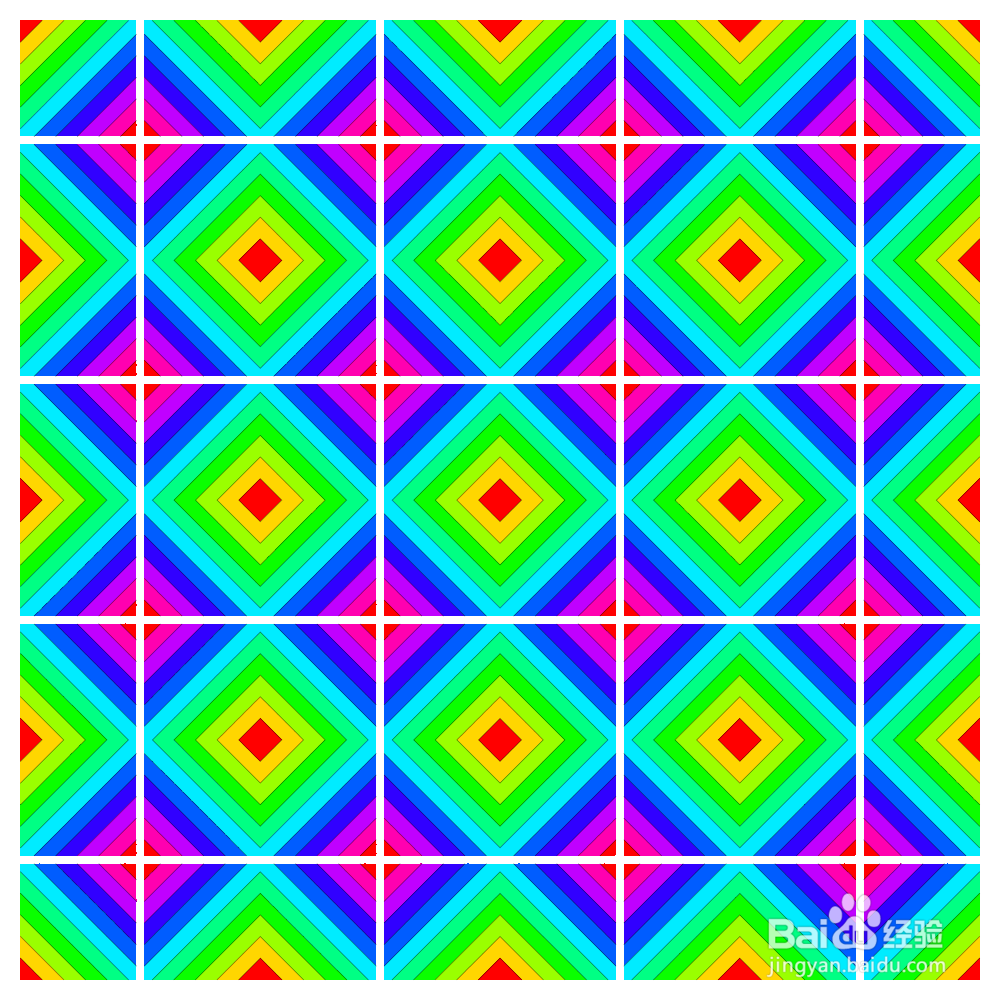
7、斜向排列:
f[g[x, 4], g[x + y, 6]]
8、半球形函数:
f[x_, y_] := Sqrt[1 - x^2 - y^2]
拓展为周期都为2的双周期函数:
f[g[x, 2], g[y, 2]]
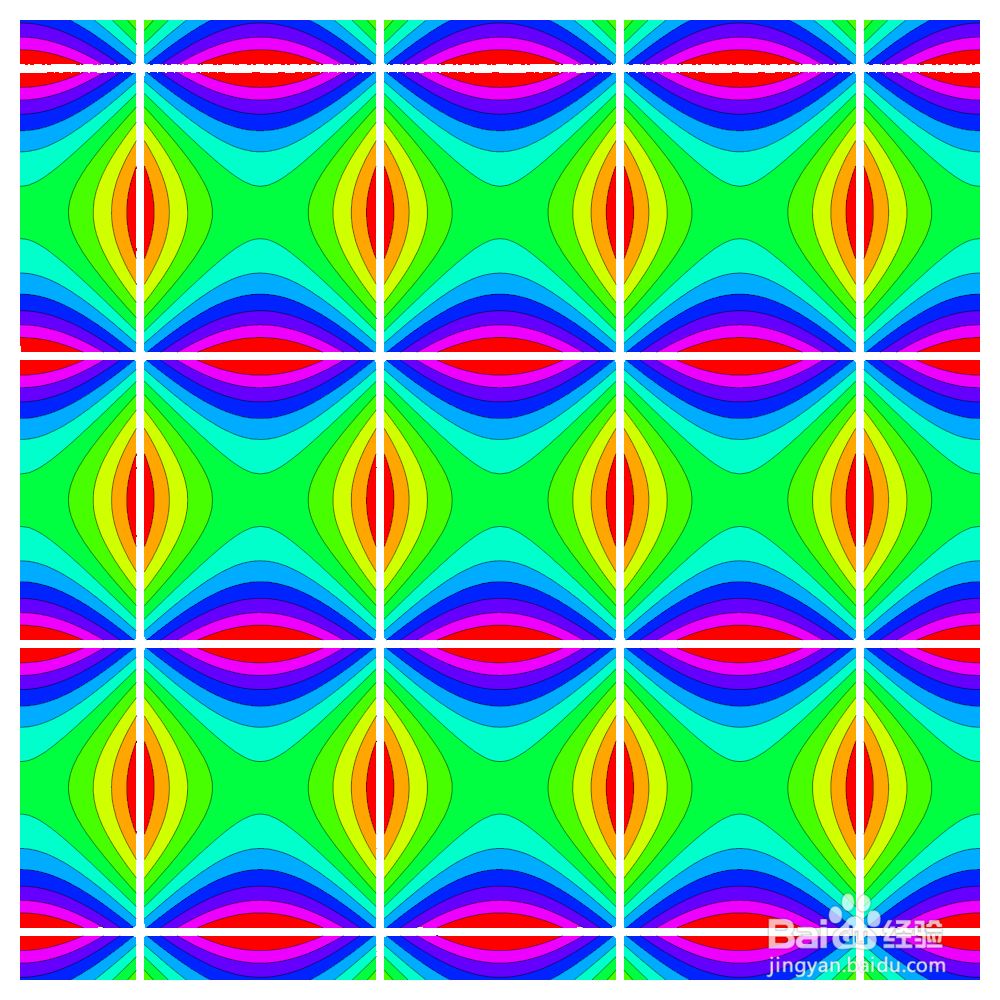
9、斜向排列,表现为椭圆形态:
f[g[x, 2], g[x + y, 2]]


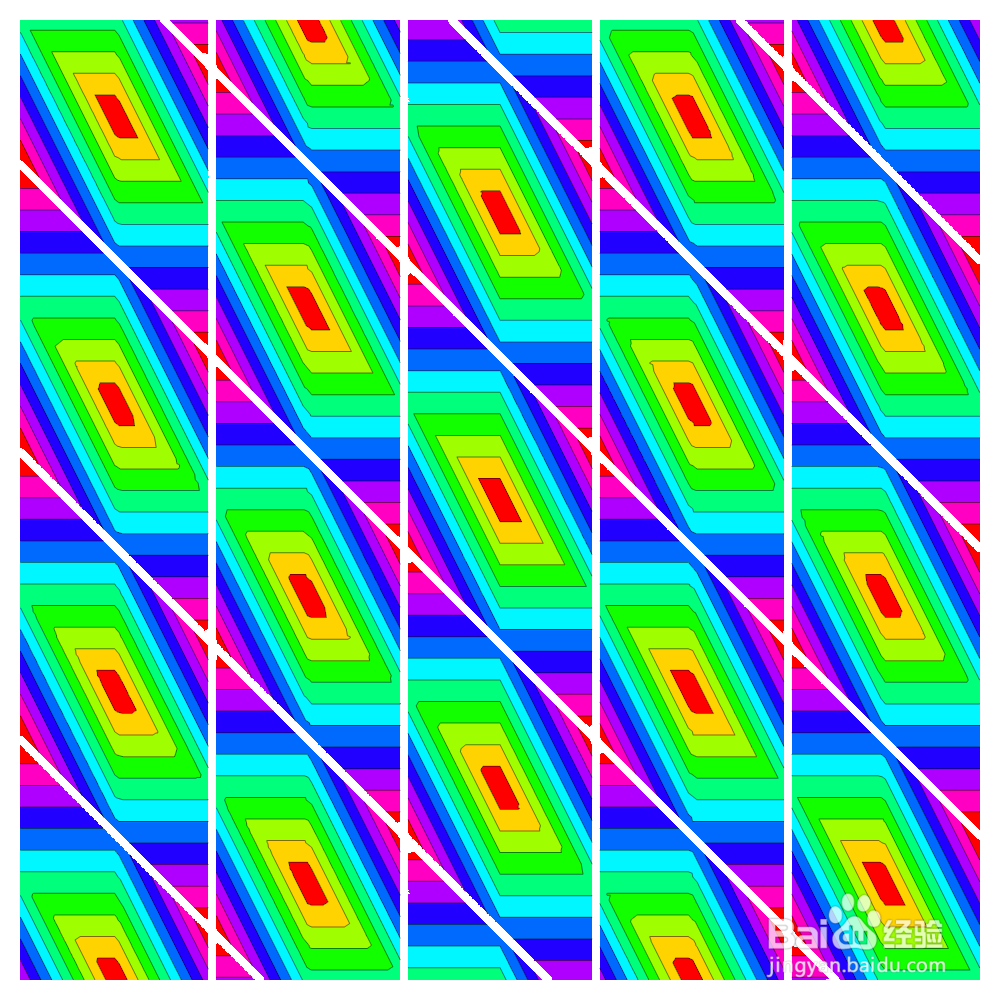
10、马鞍面:
f[x_, y_] := 1 - x^2 + y^2
拓展为双周期函数:
f[g[x, 5], g[y, 6]]
其等高线图,表现为截断了的一组“双曲线”。
11、斜向排列,看似发生了“扭曲”,实则仍是双曲线:
f[g[x + y, 5], g[y, 6]]

12、对于本身就是双周期的函数,也可以暴力截断,再拓展为新的双周期函数:
f[x_, y_] := Sin[x + y]
f[g[x, 5], g[y, 6]]