1、打开一个excel文件

2、按alt+F11后会打开一个VBE窗口
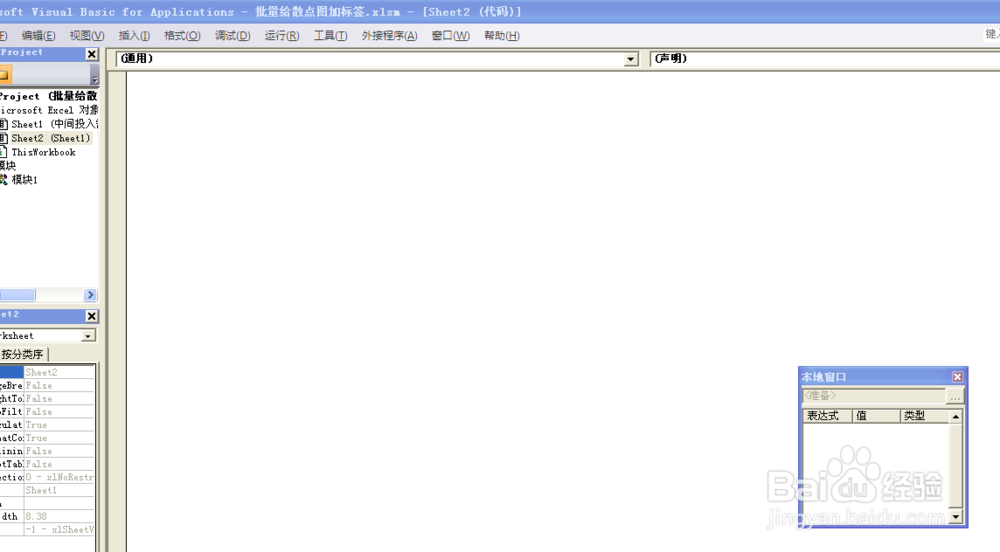
3、在VBE的左侧的VBA对象中选择VBAProject(PERSONAL.XLSB)后右键,插入-模块
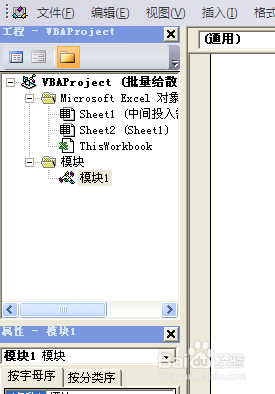
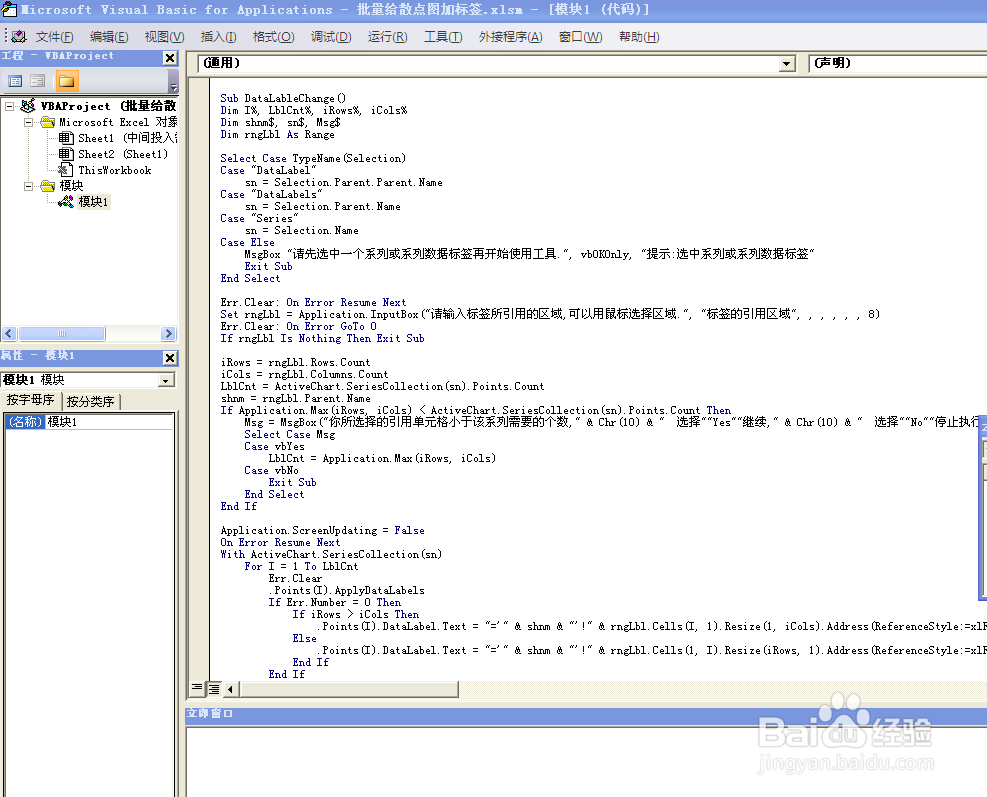
4、把上述代买复制到右侧空白区域,然后保存并关闭VBE窗口
Sub DataLableChange()
Dim I%, LblCnt%, iRows%, iCols%
Dim shnm$, sn$, Msg$
Dim rngLbl As Range
Select Case TypeName(Selection)
Case "DataLabel"
sn = Selection.Parent.Parent.Name
Case "DataLabels"
sn = Selection.Parent.Name
Case "Series"
sn = Selection.Name
Case Else
MsgBox "请先选中一个系列或系列数据标签再开始使用工具.", vbOKOnly, "提示:选中系列或系列数据标签"
Exit Sub
End Select
Err.Clear: On Error Resume Next
Set rngLbl = Application.InputBox("请输入标签所引用的区域,可以用鼠标选择区域.", "标签的引用区域", , , , , , 8)
Err.Clear: On Error GoTo 0
If rngLbl Is Nothing Then Exit Sub
iRows = rngLbl.Rows.Count
iCols = rngLbl.Columns.Count
LblCnt = ActiveChart.SeriesCollection(sn).Points.Count
shnm = rngLbl.Parent.Name
If Application.Max(iRows, iCols) < ActiveChart.SeriesCollection(sn).Points.Count Then
Msg = MsgBox("你所选择的引用单元格小于该系列需要的个数," & Chr(10) & " 选择""Yes""继续," & Chr(10) & " 选择""No""停止执行.", vbYesNo, "引用单元格数量不够")
Select Case Msg
Case vbYes
LblCnt = Application.Max(iRows, iCols)
Case vbNo
Exit Sub
End Select
End If
Application.ScreenUpdating = False
On Error Resume Next
With ActiveChart.SeriesCollection(sn)
For I = 1 To LblCnt
Err.Clear
.Points(I).ApplyDataLabels
If Err.Number = 0 Then
If iRows > iCols Then
.Points(I).DataLabel.Text = "='" & shnm & "'!" & rngLbl.Cells(I, 1).Resize(1, iCols).Address(ReferenceStyle:=xlR1C1)
Else
.Points(I).DataLabel.Text = "='" & shnm & "'!" & rngLbl.Cells(1, I).Resize(iRows, 1).Address(ReferenceStyle:=xlR1C1)
End If
End If
Next
End With
Err.Clear: On Error GoTo 0
Application.ScreenUpdating = True
End Sub
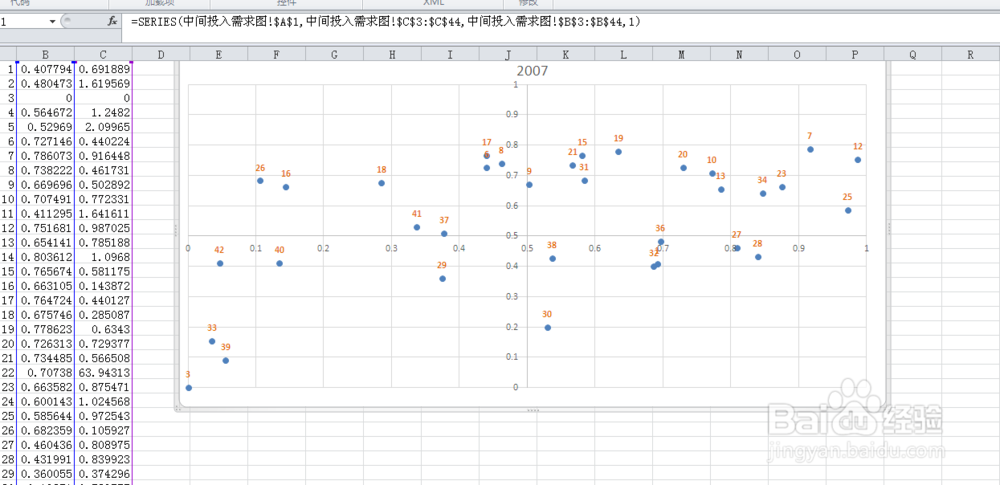
5、.在Excel的开发选项标签中点击“宏”,选择PERSONAL.XLSB!DataLableChange就可以执行了
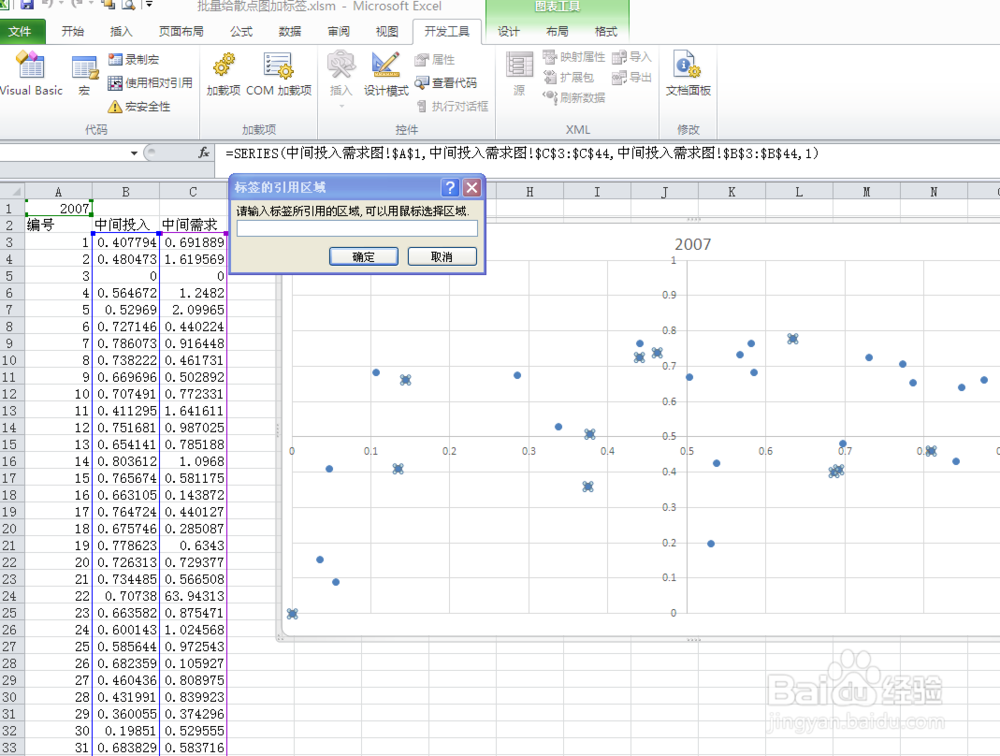

6、当然,执行前得先选中需要被替换的标签,然后执行上面的4,然后选择替换用的标签,确定就可以了